
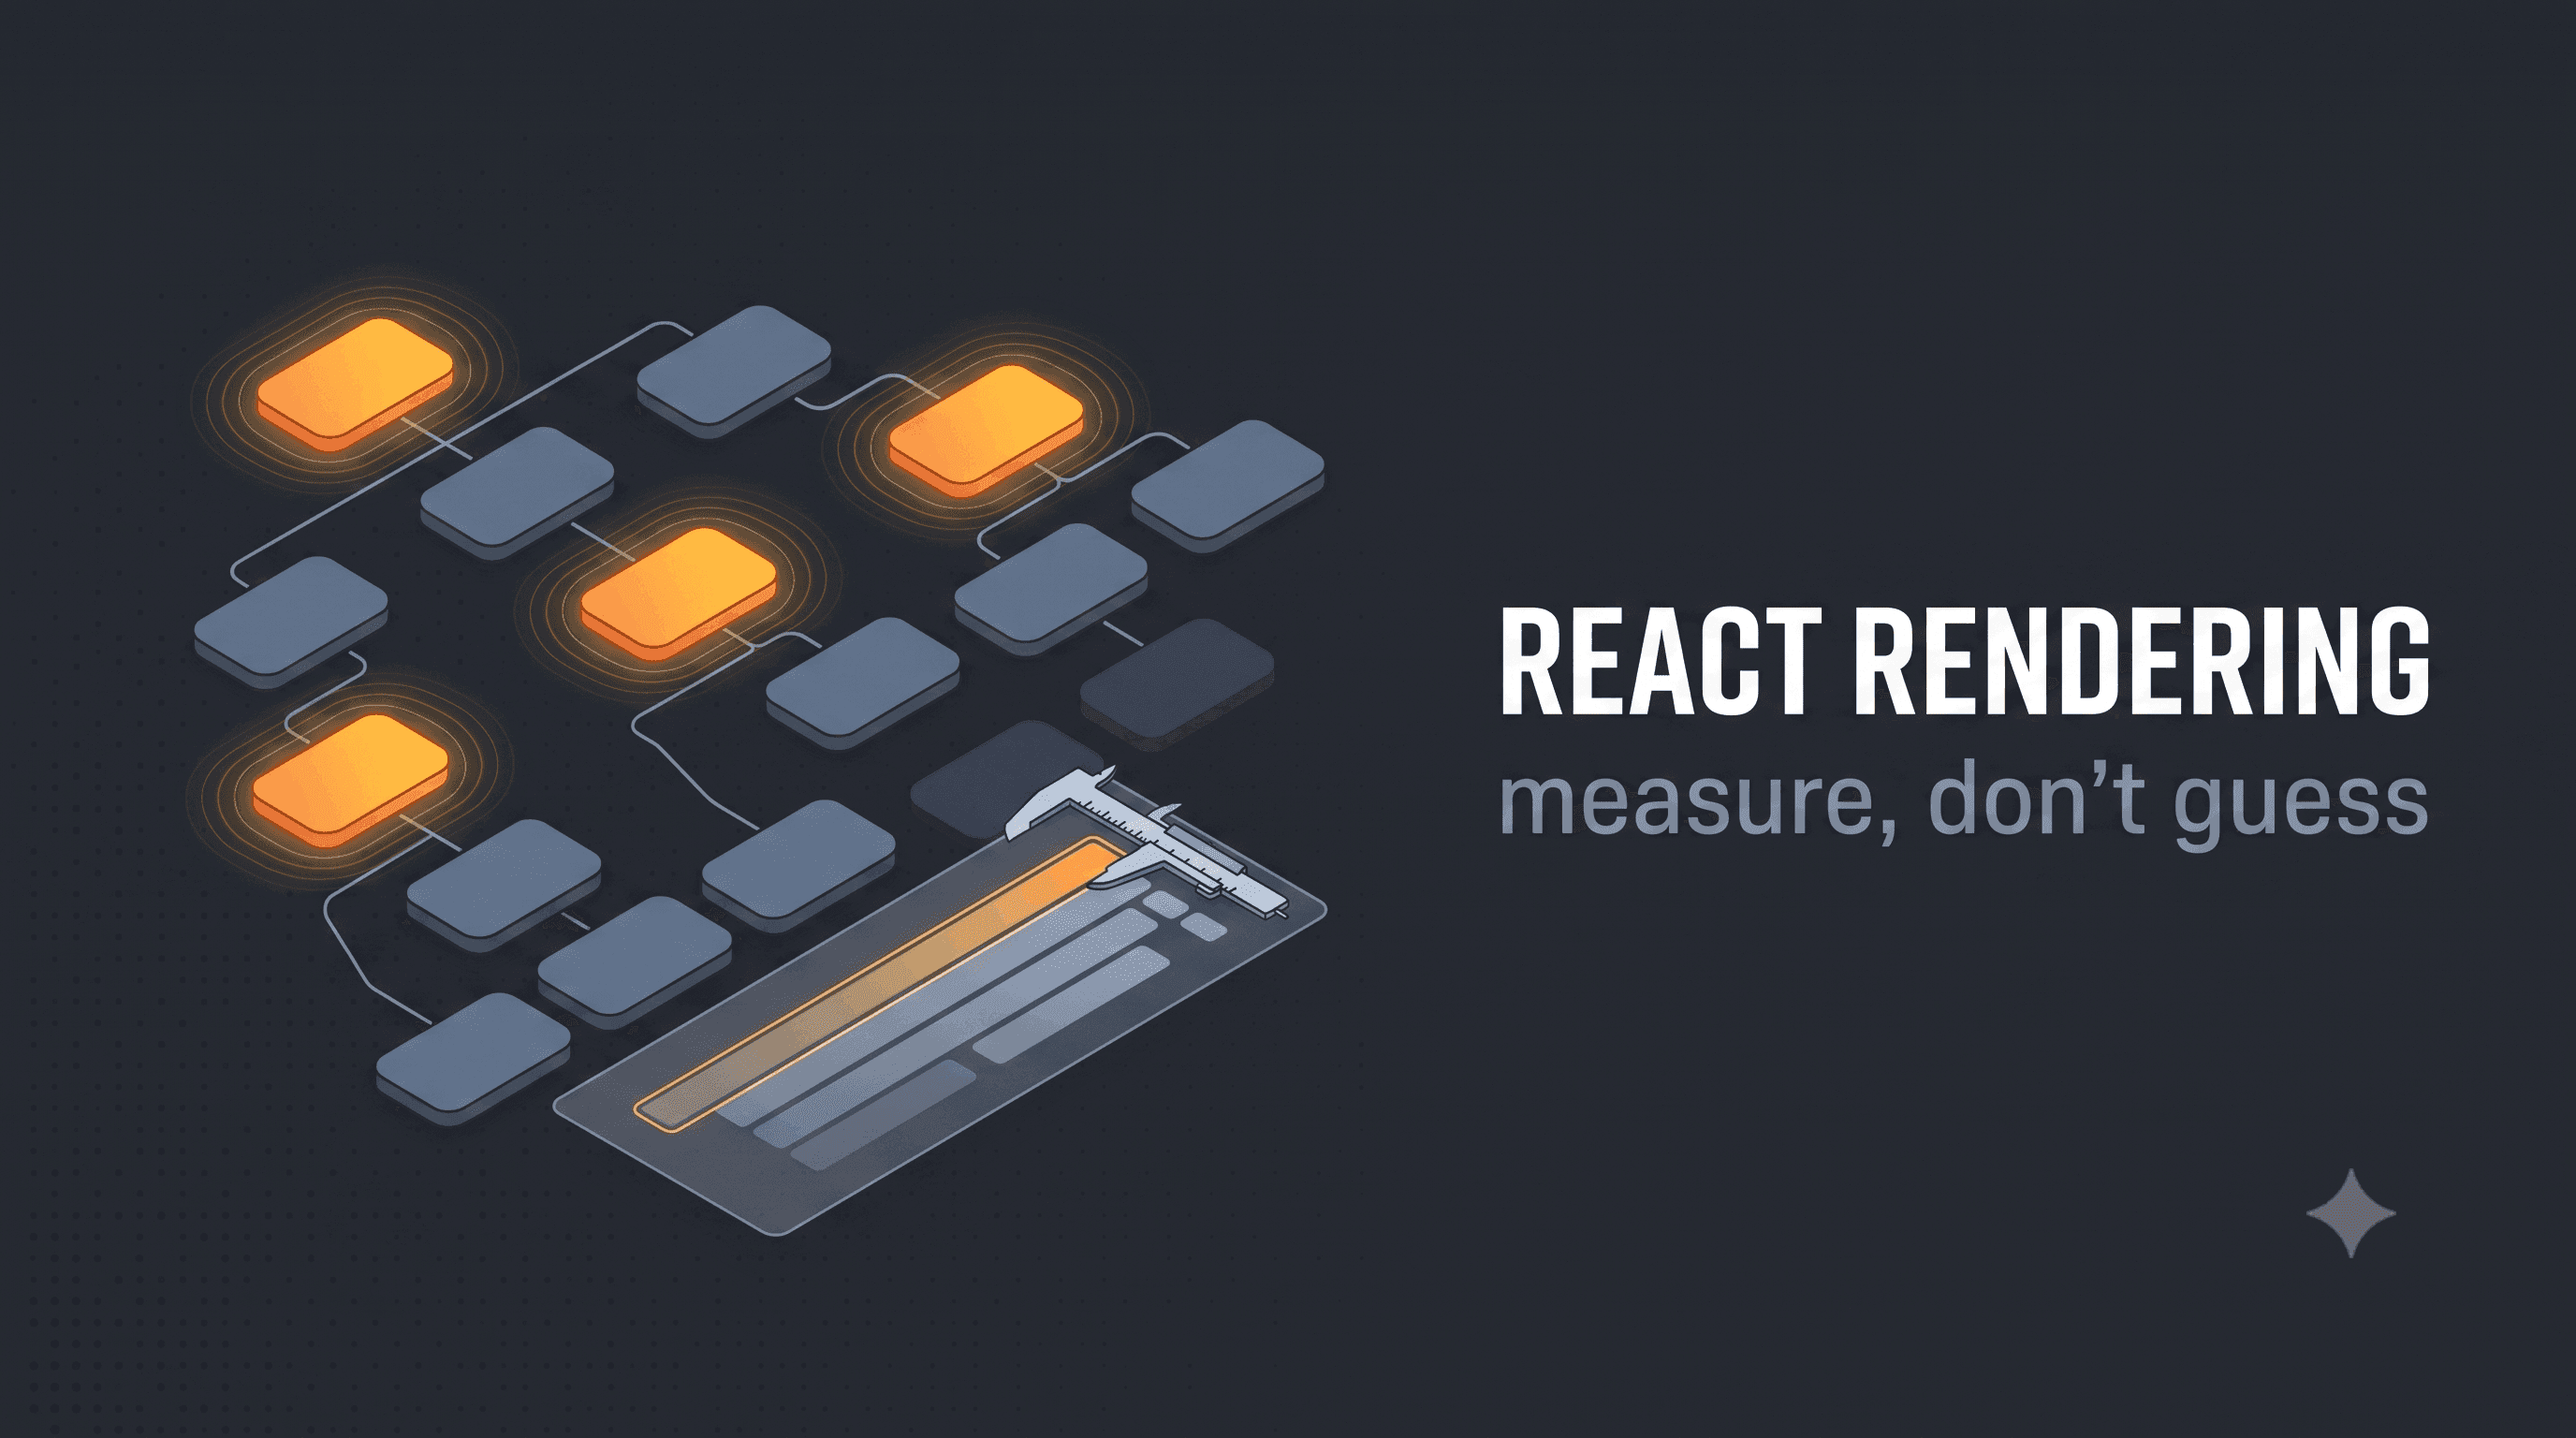
Wrapping every component in React.memo and every value in useMemo is not a performance strategy — it is a way to add complexity in places that were never slow while missing the one component that actually re-renders 200 times a second. Real performance work starts with measuring, not with reflexive memoization.
Profile before you optimize anything
The React DevTools Profiler records a render pass and shows exactly which components re-rendered, how long each took, and — critically — why each one re-rendered: a prop changed, a hook's state changed, or a parent re-rendered and passed the same props down anyway. That last case, an unnecessary re-render from a parent, is the one worth fixing; the other two usually mean the render was doing real, necessary work.
import { Profiler } from 'react';

function onRenderCallback(id, phase, actualDuration) {
  if (actualDuration > 16) {
    console.warn(`Slow render: ${id} took ${actualDuration}ms (${phase})`);
  }
}

<Profiler id="ProductList" onRender={onRenderCallback}>
  <ProductList products={products} />
</Profiler>
The cause is usually state placed too high, not missing memoization
A search input's keystroke state living in the same component that renders a thousand-row table forces that entire table to re-render on every character typed, regardless of how many child components are wrapped in memo. Moving the input's state into its own small component — so only the input re-renders on each keystroke — usually fixes more jank than any amount of memoization applied to the table below it.
useMemo/useCallbackonly help when the recomputation is genuinely expensive OR the referential stability matters for a child wrapped inmemo— applied everywhere else, they add comparison overhead for no benefit.React.memoon a component that always receives new object or array props (created inline in the parent's render) does nothing — the shallow comparison fails every time regardless.- Virtualize long lists (
react-window/@tanstack/react-virtual) instead of rendering a thousand DOM nodes and hopingmemomakes it fast — memoization cannot fix a list that should not be fully mounted in the first place. - Context updates re-render every consumer regardless of
memo, unless the context value itself is memoized and the consuming components only read the slice of it they need. - A key prop that changes unnecessarily (an index instead of a stable id) forces React to unmount and remount instead of updating in place — check this before assuming a slow render is a computation problem.
When memoization is the right fix
A genuinely expensive computation — sorting or filtering a large array on every render — belongs in useMemo, and a callback passed to a memoized child that would otherwise break the memoization belongs in useCallback. The profiler tells you which case you are in: a long "self time" on a component means the computation itself is slow; a component re-rendering with identical props means the parent is the problem, not that component.
// Worth memoizing: genuinely expensive, runs on every keystroke otherwise
const filtered = useMemo(
  () => products.filter((p) => p.name.includes(query)),
  [products, query],
);

// Only needed because ProductRow is wrapped in memo and would otherwise
// receive a new function identity on every parent render
const handleSelect = useCallback((id: string) => onSelect(id), [onSelect]);
A component re-rendering is not automatically a bug. React re-renders are cheap by design; the profiler exists precisely to tell you which re-renders are expensive enough to matter and which are noise.
Code-splitting: the render that never has to happen at all
The fastest render is the one that never ships to the browser in the first place. A heavy component only shown behind a modal, a chart library only needed on one admin page, or a rich text editor only used on the post-creation screen do not belong in the initial bundle every visitor downloads — React.lazy combined with Suspense defers loading their code until the moment they are actually about to render.
const RichTextEditor = lazy(() => import('./RichTextEditor'));

function PostEditorPage() {
  const [showEditor, setShowEditor] = useState(false);

  return (
    <>
      <button onClick={() => setShowEditor(true)}>Start writing</button>
      {showEditor && (
        <Suspense fallback={<EditorSkeleton />}>
          <RichTextEditor />
        </Suspense>
      )}
    </>
  );
}- Split at route boundaries first — a page a given user never visits should never cost them a byte of JavaScript.
- A bundle analyzer (
source-map-explorer,rollup-plugin-visualizer) is the tool that tells you which component is actually worth splitting, not intuition about what "feels heavy." - Lazy-loading a component that renders immediately on every page load adds a network round trip for no benefit — reserve it for content that is conditionally shown.
Context re-renders every consumer — split it accordingly
A single AppContext bundling theme, auth state, and cart contents means updating the cart count re-renders every component reading theme too, even though nothing about the theme changed. Splitting one large context into several small, focused ones — ThemeContext, AuthContext, CartContext — means a cart update only re-renders components that actually subscribed to the cart.
// One large context: any change re-renders every consumer, including
// components that only ever read `theme`.
const AppContext = createContext<{ theme: Theme; cart: Cart; user: User }>(...);

// Split: a cart update only re-renders components reading CartContext.
const ThemeContext = createContext<Theme>(defaultTheme);
const CartContext = createContext<Cart>(emptyCart);
const AuthContext = createContext<User | null>(null);
For a context value that changes frequently and is read by many components, an even finer-grained approach — a selector-based store (Zustand, Jotai) instead of Context — lets each component subscribe to just the slice of state it actually renders from, avoiding the "any change re-renders every consumer" behavior that plain Context always has by design.
Performance work has diminishing returns — know when to stop
Once the profiler shows every remaining re-render taking under a few milliseconds and the perceived experience is smooth, further optimization work trades engineering time for a change no user will ever notice. The discipline that matters is knowing when a component is "fast enough" for its actual role on the page, not chasing every re-render down to zero regardless of whether it was ever visible as jank.
Setting an explicit performance budget up front — a target frame time, or a maximum bundle size for a given route — gives a concrete stopping point, and revisiting it only when a regression is measured is a far better use of time than continuously re-optimizing a component that was never actually the bottleneck.
A profiling session is only as good as the interaction it captures — profiling a page on first load misses the re-renders that only happen after a user types in a search box or opens a filter panel, which is often where the real jank actually lives. Recording a profile that exercises the specific interaction a user complained about, not just a generic page load, is what makes the resulting flame graph point at the component actually worth fixing.
It is also worth remembering that a slow network request masquerading as a slow render is a common misdiagnosis — a component waiting on a fetch can look identical to a component doing expensive computation in the profiler's timeline unless the fetch itself is explicitly marked. Checking the network tab alongside the render profiler before reaching for useMemo saves the embarrassment of memoizing a computation that was never actually the bottleneck.
Conclusion
Most React performance problems are solved by moving fast-changing state closer to the component that actually needs it and by virtualizing lists that should never have been fully mounted — not by wrapping everything in memo. Reach for memoization once the profiler shows a specific, expensive re-render, not as a default habit applied everywhere.